Long Retirement

Retirement is the part of Keynes’s leisure that the rich countries actually took. For thirty years people left work earlier and lived longer; since about 2000 the exit age has been rising again, and in Portugal it is now tied by law to how long people live. This essay asks how long the last part of life lasts, how much of it is spent in good health, whether the pension that pays for it is enough, and who carries the adjustment.
For most of history old age was not a stage of life with its own income. People worked until they could not, and then depended on their children, their savings or charity. Retirement as a mass condition, a period of years that most people reach and live through on a pension, is little more than a century old. Germany’s old-age insurance law of 1889, pushed through by Bismarck, paid a pension from the age of 70, when few workers lived that long; the age was lowered to 65 in 1916.[1] Britain’s Old-Age Pensions Act of 1908 paid a means-tested five shillings a week from 70. The United States’ Social Security Act of 1935 settled on 65, which became the conventional age across much of the rich world.[2] Portugal built its own system later and in stages, from the corporatist previdência funds of the 1930s to the universal social security of the democracy, which extended pensions to farm workers and to people who had never been able to contribute.

The first essay in this series, The Fifteen-Hour Week, found that the rich countries took only about a fifth of a century’s productivity growth as shorter working weeks. Its retirement section added the qualification that matters here: counted over a whole career rather than a single year, much of Europe took close to a third or more of its gains as time, and a large part of that time came at the end of life. The second, The Two-Thirds Country, found that Portugal, with less productivity to share, had taken less of it as shorter weeks than almost anyone. This essay follows the time that was taken at the end: how long it lasts, how healthy it is, what it costs and what it pays.
Down for thirty years, up for twenty-five
The OECD has estimated, for most of its member countries since 1970, the average age at which people actually leave the labour market, which is often quite different from the official pension age.[3] Figure 1 shows it for men. Every line has the same shape, a V. In 1970 men left work between 65 and 69; Portuguese men, many of them farmers and self-employed without a pension worth stopping for, at 69. Over the next thirty years the average fell by five to nine years, to between 58 and 63 around 2000: 58.4 in France, 59.5 in the Netherlands, 60.7 in Portugal. Then it turned. By 2024 Portuguese men were leaving work at 66.5, Dutch men at 65, American men at 67.3. Women followed the same V, in Portugal from 68.9 in 1970 to 58.0 in 2000 and back to 64.5.
The fall had several causes. Pensions matured and became worth retiring on. Governments in the 1970s and 1980s used early retirement, often through disability and unemployment schemes, to take older workers out of labour markets that had too few jobs, on the mistaken theory that it would make room for the young. And the systems themselves rewarded leaving early: a cross-country study led by Jonathan Gruber and David Wise found that the implicit tax on working an extra year after the early-retirement age explained much of the difference in exit ages between countries.[4] The rise since 2000 is mostly the undoing of those incentives: early-retirement routes closed, penalties added for leaving early, and official ages raised. Meanwhile life expectancy at 65 kept rising, by one to two years every decade. The combination, as the first essay showed, took the number of years a Portuguese man could expect to live after leaving work from under ten in 1970 to almost nineteen in 2000, and it has stayed close to eighteen since. For Portuguese women it went from 12 to 23.
It is already happening
The question in the title of so many policy reports, whether people will have to work longer, has already been answered by the data. Figure 2 shows the share of people aged 55 to 64 in work. In 2000 it was under 30 per cent in France and Italy and under 40 in Germany and Spain. By 2025 it was over 60 per cent in all four and 75 per cent in Germany. Portugal, which started higher, at about 51 per cent, fell back during the crisis to 47 per cent and then rose to almost 70.[5]
Portugal is unusual at the older end too. A quarter of Portuguese aged 65 to 69 still work, a share that was already 27 per cent in 2000, when in France and Spain it was two to four per cent. In most of northern Europe the share has climbed to around 30 per cent from very low levels. In Portugal it has been high for a long time, and not always by choice: much of it is small farmers, self-employed people and those whose pensions are too small to live on. Eurostat’s estimate of the expected length of a working life puts the average Portuguese at 39.7 years in 2025, two years more than the EU average, and more than in Spain, France or Italy.
How many of those years are healthy
Adding years of work at the end makes sense if the extra years of life are healthy ones, and the case for tying the pension age to life expectancy assumes that they are. Eurostat estimates, from surveys that ask people whether health problems limit their usual activities, how many of the years a 65-year-old can expect to live will be free of such limitations. Figure 3 shows the answer for 2024.[6]
Total life expectancy at 65 is remarkably similar across these countries, between about 20 and 22 years. The healthy part is not. A Swede of 65 can expect 14.2 healthy years, an Italian 13.1, a Spaniard 12.5. A Portuguese can expect 9.8, slightly below the EU average of 10.3, and fewer than half of his or her remaining years. Asked directly, 28 per cent of Portuguese over 65 describe their health as bad or very bad, the highest share in this group of countries and ten points above the EU average. The Portuguese figures are improving fast: the share reporting bad health was 49 per cent in 2010, and healthy years at 65 have risen from about six to almost ten in a decade. But the starting point was low, and it matters for the rule Portugal has chosen.
That rule raises the pension age by two-thirds of every gain in life expectancy at 65.[7] It uses total life expectancy, not healthy life expectancy, and the average, not the life expectancy of the people who will actually be asked to work longer. The averages hide large differences. In the United States, the richest one per cent of men live about 15 years longer than the poorest one per cent.[8] European gaps are smaller, and Eurostat’s figures by education show a gap at 65 of about a year in Portugal and Sweden, but differences in health, and in how physically demanding the last working years are, are much larger than differences in lifespan. A builder and a professor who both retire at 67 are not being asked for the same thing.

A generous formula and poor pensioners
On paper, Portugal has one of the most generous pension systems in the OECD. The organisation’s standard calculation, for a man who starts work at 22, earns the average wage throughout and retires at the normal age, gives a Portuguese net pension of 93 per cent of his last net earnings, against 70 in France, 53 in Germany and 51 in the United States.[3] The reality of Portuguese pensioners looks different, because hardly any of them had that career. Most of today’s retired Portuguese worked in an economy of low wages, informal work and short contribution records, and many draw the minimum or social pension. Eurostat’s measure of what pensioners actually receive, the median pension of people aged 65 to 74 as a share of the median earnings of those aged 50 to 59, is 0.68 in Portugal, somewhat above the EU’s 0.60 but nowhere near the formula.[9]
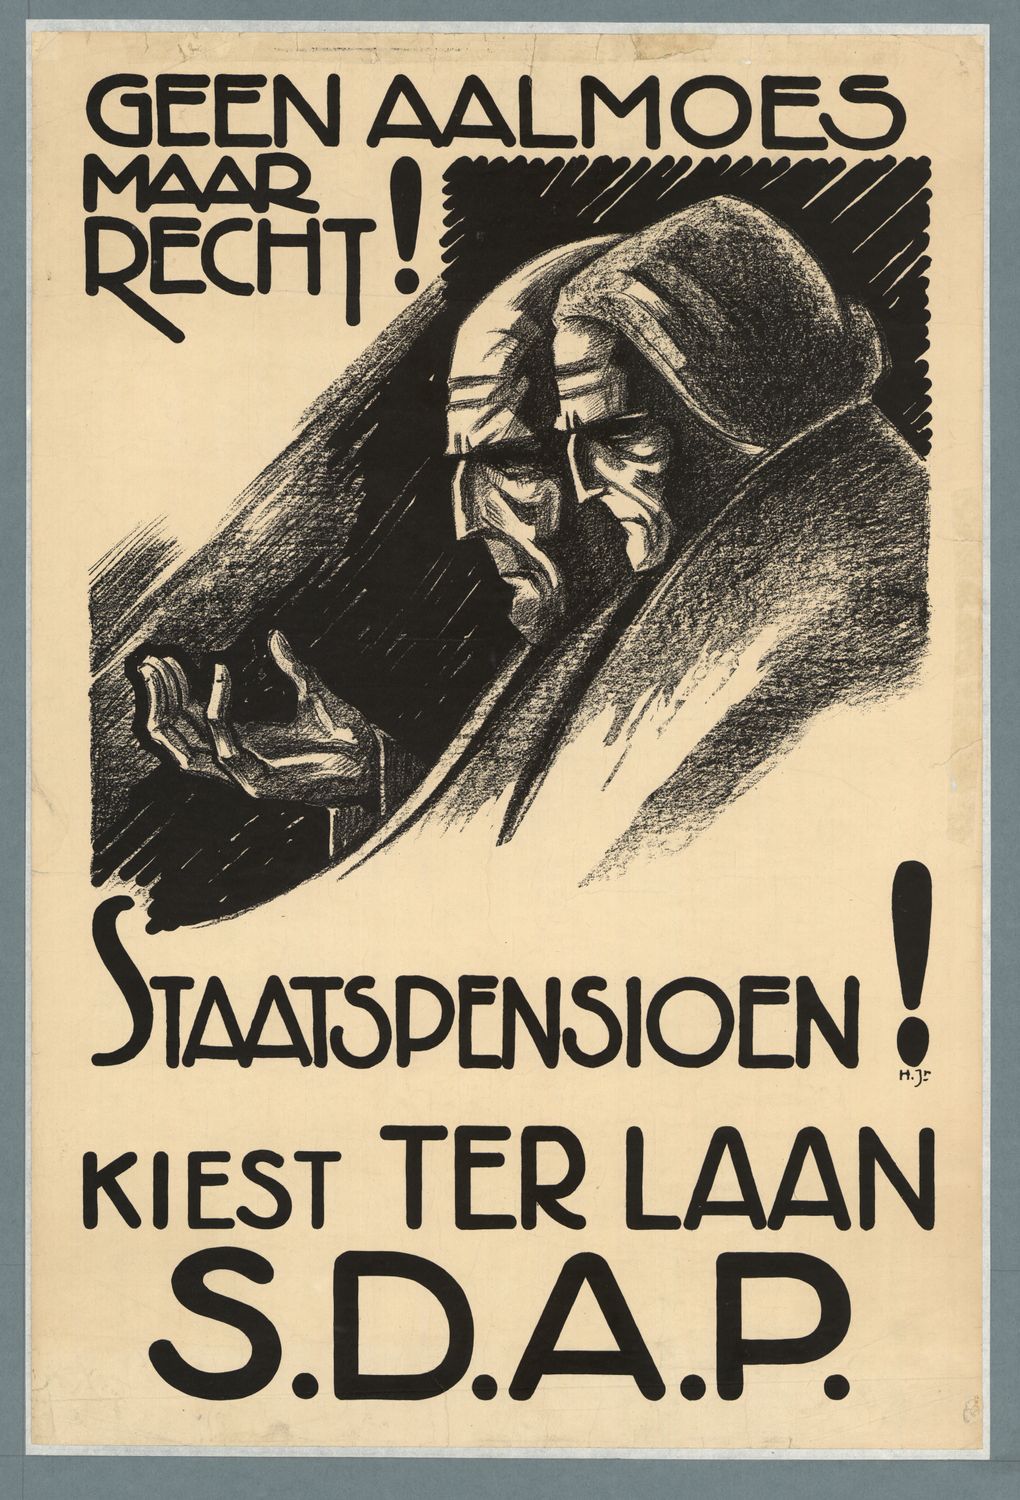
The clearest measure is poverty. Figure 4 compares the share of people below the poverty line, 60 per cent of the national median income, among those aged 65 and over and those aged 18 to 64. In Spain, France and Sweden older people are less likely to be poor than working-age adults. In Portugal it is the other way round: 17.8 per cent of over-65s were at risk of poverty in 2025, against 13.9 per cent of working-age adults, and among older women the figure was 19.4 per cent. The trend is not steady. Old-age poverty in Portugal fell from 27.6 per cent in 2005 to 15.1 per cent in 2014, as the relative incomes of the young collapsed in the crisis and minimum pensions were protected; it rose again to 21.1 per cent in 2024, largely because wages, and with them the poverty line, rose faster than pensions, and eased to 17.8 in 2025.[10]
Poverty lines are relative, so a pensioner whose income is fixed becomes “poorer” on this measure when everyone else gets a raise; the jump in 2024 is partly that. But the relative measure is the one that captures what the first essay called Keynes’s relative needs, and it tells a consistent story: in Portugal the time taken at the end of life is time on a small income, and the smallest incomes are those of the oldest women, who had the shortest paid careers.
The adjustment is already written in
Portugal spent about 12.5 per cent of its GDP on pensions of all kinds in 2023, down from a peak of 15.6 per cent in 2013, when GDP had shrunk and the number of pensioners had not.[11] The official projections, compiled by the OECD, show public pension spending rising from about 12 per cent of GDP to a peak of about 15 per cent around 2045, as the baby-boom generations retire, and then falling back to under 12 per cent by 2060 (Figure 5). Spain’s spending is projected to rise to about 17 per cent and stay there; Italy’s to peak around 17 and fall; France’s and Germany’s to stay roughly flat.[3]
The Portuguese curve falls after 2045 not because the country gets younger but because the rules adjust. The reforms of 2002 and 2007 moved the calculation of new pensions to the whole career rather than the best years, tied their annual updating to growth and inflation rather than to wages, and introduced a sustainability factor, which since 2014 applies to those who retire before the normal age; and since 2014 that normal age has followed life expectancy.[7] The factor itself has grown as life expectancy has: it cut early pensions by 16.9 per cent in 2025 and by 17.6 per cent in 2026. Each of these mechanisms moves the cost of longer lives from the budget to pensioners, either as more years of work or as a smaller pension relative to wages. That is the choice most European countries have made. It keeps the systems solvent. It also means that the generation now in its thirties and forties, the one that emigrated in the crisis and pays today’s rents, will work longer than its parents for a pension that replaces less of its pay.
The next quarter-century
Several things are predictable. The Portuguese pension age will go on rising by about two months a year while life expectancy rises: 66 years and 11 months in 2027, and, on the OECD’s calculation, 68 for someone entering the labour market today. Other countries are going further, to 70 in Italy, the Netherlands and Sweden and 74 in Denmark. The number of people over 65 for every hundred of working age in Portugal will rise from about 43 today to about 69 by 2050 on Eurostat’s baseline, one of the highest in Europe; the large immigration since 2022, discussed in the second essay, will lower that somewhat. The need for long-term care will grow faster than the population over 65, because the fastest-growing group is the over-80s.
Less predictable, and more important, is whether the extra working years will be healthy and whether they will be shared fairly. Three things are worth watching. Whether healthy life years at 65 keep rising in Portugal as fast as they have since 2015; if they do, a later pension age will cost much less than it seems. Whether old-age poverty, especially among women, falls as the cohorts with longer and better-paid careers reach retirement, or rises as pensions fall behind wages. And whether any country moves from tying the pension age to average life expectancy towards something that accounts for how long, and how hard, people have actually worked. Several already allow earlier retirement after very long contribution records; Portugal does, with conditions. The broader principle, that the time dividend at the end of life should be shared according to health and work rather than averaged, is still mostly a debate.
The leisure we took
Keynes imagined his grandchildren working three hours a day. They did not. What they got instead, in most of Europe, was something he barely mentioned: a decade or two at the end of life with no work at all, paid for by the productivity he predicted. It was the largest single form in which the twentieth century took its gains as time, and the one people value most; nobody campaigns to work until they die. It is now being shortened, for sound demographic reasons, by rules that treat everyone as average.
The argument of all three essays comes back to the same point. How the gains of productivity are split, between income and time, between the top and the middle, between the working years and the years after, is not decided by technology or by demography alone. It is decided by rules, and rules can be written with the builder and the professor, the old woman on a minimum pension and the young emigrant paying London rent, in mind. Whether they will be is the part of Keynes’s question that remains open.
Where this could go
A healthy-years pension age. A calculation of what the Portuguese pension age would be if it tracked healthy life expectancy at 65 rather than total life expectancy, and how that would change by sex and by education, would put a number on the argument in the health section.
The pensions of the emigrants. Hundreds of thousands of Portuguese who worked abroad in the 2010s will draw pensions from several countries. How their contribution records are pieced together, and what they will receive, is an open and very Portuguese question.
This piece was written collaboratively with Claude Opus 5.5 (Anthropic): human specification, editorial direction and critical review; machine data research, analysis and drafting. The numbers are computed by scripts/retirement.py from the OECD’s Pensions at a Glance database and Eurostat’s labour-force, income, health and social-protection statistics; results are in docs/retirement-results.json and the figures in docs/retirement-figures.html. Healthy life years rest on self-reported limitations and the series has breaks; poverty rates are relative to each country’s median income in the same year. The OECD’s replacement rates are for a hypothetical full-career worker under current rules, not for today’s pensioners. The photographs are from Wikimedia Commons and credited with their licences in the captions; local copies are in assets/images/2026/.
The cover is computed by the same script: Figure 3 without its labels, one bar per country, healthy years in teal and the rest in pink, with Portugal in dark ink and magenta.
Authored by: Luis Matos Ferreira — Physicist, Developer, Writer
- The Fifteen-Hour Week — Keynes’s prediction, productivity, hours and pay, and where the time went.
- The Two-Thirds Country — the same questions for Europe and Portugal.
- Gesetz betreffend die Invaliditäts- und Altersversicherung, 22 June 1889 (German Reich), in force 1891; the pension age was lowered from 70 to 65 in 1916.
- Old-Age Pensions Act 1908 (8 Edw. 7 c. 40), United Kingdom, pensions payable from 1 January 1909; Social Security Act of 14 August 1935, United States.
- OECD, Pensions at a Glance database (OECD Data Explorer, DSD_PAG@DF_PAG): average effective age of labour market exit and expected years after exit, by sex, 1970–2024; net pension replacement rates for an average earner; current and future normal retirement ages; projections of public expenditure on pensions.
- Gruber & Wise (eds.), Social Security and Retirement around the World, University of Chicago Press, 1999.
- Eurostat, Labour Force Survey: employment rates by sex and age (lfsa_ergan); duration of working life (lfsi_dwl_a).
- Eurostat, healthy life years and life expectancy at age 65 (hlth_hlye); self-perceived health by age (hlth_silc_01); life expectancy by educational attainment (demo_mlexpecedu).
- Decreto-Lei n.º 35/2002, de 19 de Fevereiro (whole-career pension formula); Lei n.º 53-B/2006, de 29 de Dezembro (indexation of pensions); Decreto-Lei n.º 187/2007, de 10 de Maio (sustainability factor); Decreto-Lei n.º 167-E/2013, de 31 de Dezembro, art. 20 (normal pension age moves by two-thirds of the change in life expectancy at 65); Portaria n.º 358/2024/1, de 30 de Dezembro, and Portaria n.º 476/2025/1, de 29 de Dezembro (ages for 2026 and 2027; sustainability factors for 2025 and 2026).
- Chetty, Stepner, Abraham, Lin, Scuderi, Turner, Bergeron & Cutler, “The Association Between Income and Life Expectancy in the United States, 2001–2014”, JAMA 315, 1750 (2016).
- Eurostat, EU-SILC: aggregate replacement ratio (ilc_pnp3); relative median income ratio of people aged 65 and over (ilc_pnp2).
- Eurostat, EU-SILC: at-risk-of-poverty rate by poverty threshold, age and sex (ilc_li02).
- Eurostat, ESSPROS: pension expenditure (spr_exp_pens), all pension schemes, % of GDP.





Comentários
Enviar um comentário