The Leavers
Between 2011 and 2016 more than 600,000 people left Portugal, about one resident in seventeen. The crisis ended, but departures fell back only to where they were in the mid-2000s: 65,000 to 80,000 people still leave every year. One person born in Portugal in six lives abroad, the fourth-highest share in the EU, and graduates now leave about as often as everyone else. This essay looks at who goes, where, why, and how many come back.
Portugal has always been a country of emigrants, to Brazil and the Americas and, in the 1960s, to France and Germany. This series has looked at what Portuguese work produces and pays: The Floor showed a compressed wage scale, What Schooling Bought a generation far better schooled than its parents, and The Arrivals the immigrants who now fill many jobs. This essay looks at the people who leave: how many, where to, who they are, why they go, and whether they come back.
Three counts, one shape
No one counts emigrants at the border, so there are three measures and they disagree (Figure 1). INE, the statistics institute, asks households about members who left: in 2013 it counted 54,000 permanent emigrants, leaving for a year or more, and 128,000 including those leaving for less. The Emigration Observatory adds up the Portuguese citizens recorded as arriving by the destination countries, and estimated 120,000 in 2013. All three show the same shape: departures rose from the mid-2000s, peaked in 2013 and 2014, during the bailout, and fell back by about half.[1]
Between 2011 and 2016, between 620,000 and 680,000 people left, depending on the measure: one resident in about seventeen. In 2013 the rate was 11 or 12 departures per thousand residents; in 2024 it was 6 to 7. That is half the peak, about the level of the mid-2000s, and the Observatory considers its own figures an under-count.[1] Most of those who left did not cut their ties; many come and go, and some of those counted as leaving had left before.
From London to Zurich
The destinations changed with the times (Figure 2). Before 2008, Spain’s building boom drew 27,000 Portuguese in 2007 alone. During the crisis the United Kingdom became the main destination, with over 30,000 a year registering for work there from 2013 to 2016, along with Switzerland, France and Germany. After the Brexit vote, arrivals in the UK fell by nine-tenths. In 2024 the main destinations were Switzerland (12,400), Spain (11,300), France (8,100) and Germany (7,400).[2]
Decades of departures add up. According to the United Nations, 1.8 million people born in Portugal lived abroad in 2024, equal to 17 per cent of the resident population. In the EU only Romania, Croatia and Bulgaria have a larger share; Ireland is at 14 per cent, Italy at 5 and Spain at 3 (Figure 3).[3] Many of these people left decades ago: more than half of the Portuguese-born living in France are over 55.[1]
Young, and more often graduates
Portugal does not publish the age of its emigrants, but destination countries record it. Of the 22,600 Portuguese citizens who arrived in 2024 in the seven European countries that publish full detail, 41 per cent were aged 20 to 34 and a quarter 35 to 49; one in eight was a child, a sign that families move too.[4]
Emigrants have become better educated, as the country has. Among Portuguese-born people aged 15 and over living in OECD countries, the share with a degree rose from 6 per cent in 2000/01 to 11 per cent in 2010/11. More telling is the share of Portugal’s graduates who live abroad: 8 per cent in 2000/01, 14 per cent in 2010/11 and 12 per cent in 2015/16, the latest count. That is close to Ireland (14) and Poland (13), and far above Spain (3) or Italy (7).[5] Unusually, the less educated emigrate about as much: in 2010, 17 per cent of Portuguese-born graduates aged 25 and over and 16 per cent of those with little schooling lived in the main OECD destinations.[6] No count of graduates leaving after 2016 exists.
Some professions are tracked. Nurses need a declaration from their professional order to register abroad: requests peaked in 2019, according to press reports at over 4,500, and were 1,363 in 2025, against about 3,000 nurses trained a year. Requests measure intentions, not departures. The number of Portuguese-trained nurses registered in the United Kingdom peaked at about 5,300 in 2016 and has since fallen to about 3,700.[7]
The crisis pushed; the wage gap pulls
The timing of the peak points to the crisis. In 2013, 38.5 per cent of Portuguese aged 15 to 24 in the labour market were unemployed, and 20 per cent of graduates aged 25 to 29.[8] But when unemployment among the young fell back to about 19 per cent, departures did not keep falling: since 2021 they have held at 65,000 to 80,000 a year on the two broader measures. Something other than unemployment keeps them going.
The obvious candidate is pay. A degree pays well in Portugal relative to secondary school, but the level is low. In 2022 the average Portuguese graduate earned €35,300 a year; a German graduate earned 2.1 times as much in euros and, after adjusting for the cost of living, 1.6 times; a Swiss graduate 3.7 times in euros and twice as much after adjusting (Figure 4). Even Spain pays graduates slightly more.[9]
What emigrants say is consistent with this, though no representative survey exists. In an online survey of 1,011 Portuguese graduates in Europe in 2014, 95 per cent rated professional reasons important and 81 per cent economic ones; 88 per cent said the crisis drove their departure.[10] A 2024 survey of 375 students in Porto, three-quarters of whom expected to emigrate, ranked better living conditions, including shorter working hours, above career and pay; lower taxes and cheaper housing came well behind.[11] Housing costs have more than doubled in real terms since 2013, as The Rent showed, but how much they weigh in decisions to leave has not been measured.
Coming back, and what stays behind
Since 2019, more Portuguese citizens have arrived in Portugal than left it, but the figure is misleading: half of these “Portuguese” arrivals were born abroad, the children of emigrants or naturalised foreigners. The better measure counts arrivals born in Portugal, most of them returning emigrants. They rose from about 14,000 a year before the pandemic to 28,000–34,000 in 2021–2023, close to the number of permanent departures (Figure 5).[12] The return is real, but it does not cover the temporary emigrants or the Observatory’s higher estimate of departures.
The state has tried to speed this up. The Programa Regressar, launched in 2019, pays a lump sum and moving costs to returning emigrants; it received 12,662 applications, covering 27,808 people with their families, by August 2024. Its tax side halves the income tax of returning residents for five years: 3,940 people used it in 2022, at a cost of €34 million in tax not collected.[13] Set against 65,000 to 80,000 departures a year, these are small numbers.
Emigrants also send money home: €4.3 billion in 2024, 1.5 per cent of GDP, mostly from Switzerland, France and the UK. That is much less than the 2.7 per cent of 2000, let alone the 10 per cent of the late 1970s, but still three times the share in Spain or Italy.[14] Against this, each graduate who leaves takes with them about €95,000 of public spending on their schooling, at 2023 costs for twelve years of school and a three-year degree; this is a rough illustration, not a loss, since many come back or send money. Claims that emigration costs Portugal “€2 billion a year” come from models built on assumptions of that kind.[15]
A valve that became a habit
During the crisis, emigration was a safety valve: hundreds of thousands of people who would have been unemployed found work elsewhere, and sent money home. The cost was that those who left were young, increasingly educated, and the people an ageing country can least afford to lose. Many have come back, and the return has grown since 2019, but departures have settled at 65,000 to 80,000 a year with unemployment low.
The reason they stay high is no longer unemployment but the gap between what work pays in Portugal and what it pays a few hours’ flight away. Programmes to bring people back work at the margin; the gap itself closes only as Portuguese output per hour rises, the subject of The Stalled Hour and The Business Side. Until it does, Portugal will keep training graduates for other economies, and filling its own lower-paid jobs with immigrants.
This piece was written collaboratively with Claude Opus 5.5 (Anthropic): human specification, editorial direction and critical review; machine data research, analysis and drafting. The figures are computed by scripts/emigration.py. Emigration counts use different definitions and should not be added together; rates per thousand use Eurostat’s average resident population. The age profile covers only the seven destination countries that publish arrivals by age and citizenship and is not representative of all departures. Shares of graduates abroad come from OECD censuses of emigrants (DIOC) and the IAB brain-drain data, which use different ages and destinations and are not spliced. The education cost per graduate adds Eurostat public spending per student in 2023 over the theoretical duration of each level. Results are in docs/emigration-results.json; the downloaded sources, with page or table for each number, are kept with the script’s data.
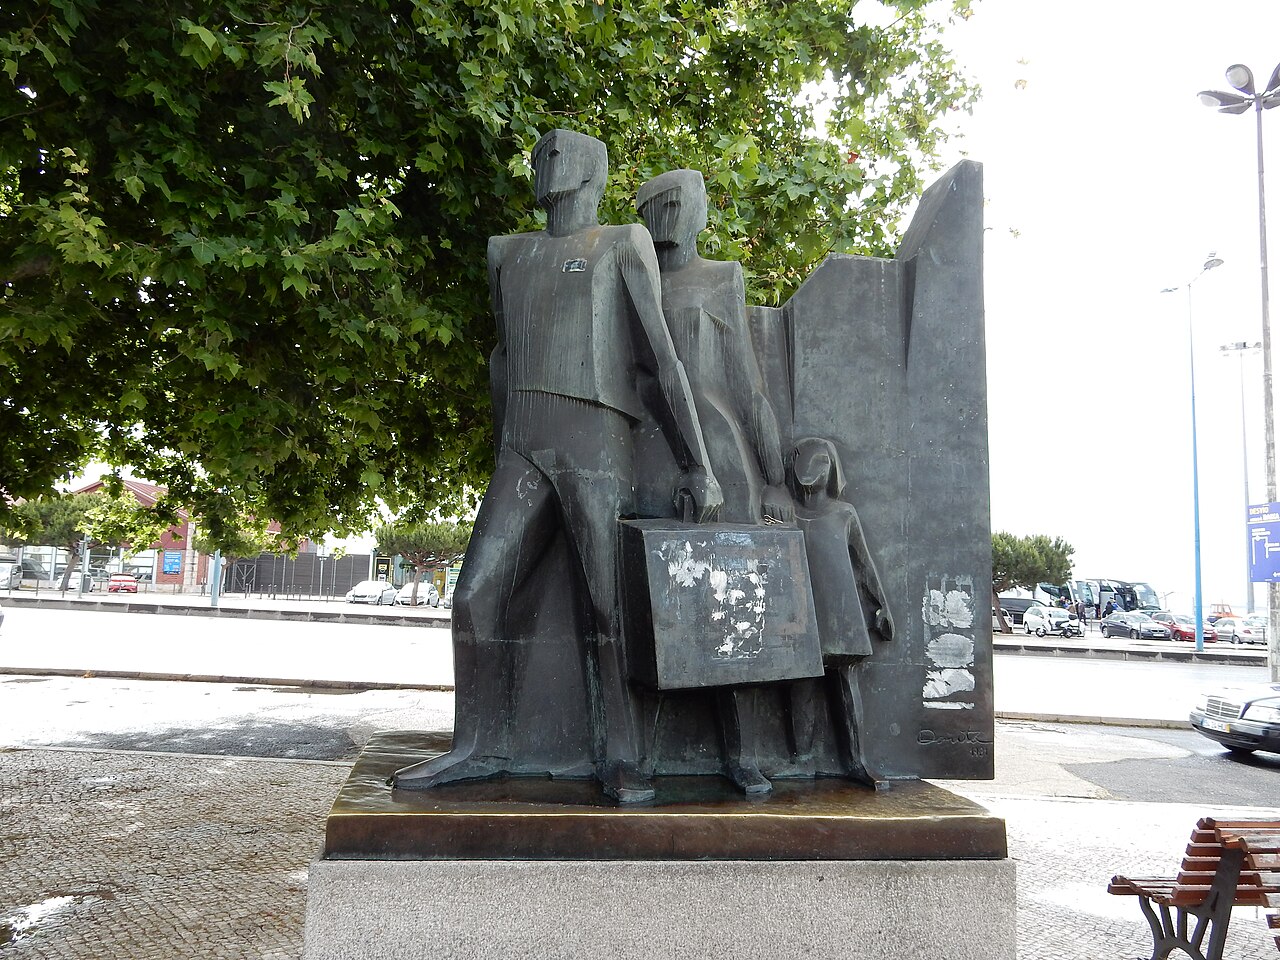
The cover photograph is Monumento all’emigrante a Stazione Santa Apollonia by Pmk58; CC BY-SA 4.0, via Wikimedia Commons, cropped.
Authored by: Luis Matos Ferreira — Physicist, Developer, Writer
- The Floor — the minimum wage and the flattened pay scale.
- What Schooling Bought — the education boom and what it paid.
- The Arrivals — immigrants in the Portuguese labour market.
- The Rent — housing and the young.
- Work, Time and Money — the reading guide to the whole series.
- Observatório da Emigração, Emigração Portuguesa 2025: Relatório Estatístico, CIES-Iscte, March 2026, Quadro 1.3 (p. 32), pp. 21–22 and 52; Eurostat, average population (demo_gind); author’s rates.
- Observatório da Emigração (2025), Quadros 2.2 and 3.1–3.56 (pp. 54, 90, 159, 178, 243, 261).
- UN DESA, International Migrant Stock 2024, via Observatório da Emigração (2025), Quadros 1.4 and 1.8 (pp. 34, 39, 45).
- Eurostat, immigration by age and citizenship (migr_imm1ctz), Portuguese citizens arriving in Austria, Germany, Spain, Italy, Luxembourg, Norway and Sweden, 2024; author’s shares.
- OECD, Connecting with Emigrants: A Global Profile of Diasporas 2015, p. 239; OECD, “A global profile of emigrants to OECD countries”, Social, Employment and Migration Working Paper 239, 2020, Table A.2; Observatório da Emigração (2025), Quadro 1.5.
- IAB brain-drain data, emigration rates by education, persons aged 25+, 20 OECD destinations, 2010.
- Ordem dos Enfermeiros, news releases of 12 January 2021, 21 October 2025 and 20 April 2026; press reports for 2019; OECD, health workforce migration database; Nursing and Midwifery Council, register data tables, March 2026.
- Eurostat, unemployment rates by age and education (lfsa_urgaed), 2008–2025.
- Eurostat, Structure of Earnings Survey 2022, mean annual earnings by education (earn_ses22_30); author’s ratios.
- R. Gomes et al., BRADRAMO project, “Fuga de cérebros”, conference presentation, University of Porto, pp. 21–23 (online survey, May–October 2014).
- Federação Académica do Porto, A emigração de jovens portugueses qualificados, presented to the Assembleia da República, 6 March 2025, pp. 9 and 14 (375 students, August–October 2024).
- Eurostat, immigration of nationals (migr_imm1ctz) and immigrants by country of birth (migr_imm3ctb), Portugal, 2008–2023.
- IEFP, Programa Regressar presentation, Seia, 21 August 2024, slide 13; GPEARI, “Impacto do Programa Regressar”, Artigo 1/2024, pp. 7–8.
- Banco de Portugal via Observatório da Emigração (2025), Quadros 4.2–4.5 (pp. 275–288).
- Eurostat, expenditure per student in public institutions (educ_uoe_fini04), 2023; author’s calculation; Federação Académica do Porto (2025), pp. 16–17; Polígrafo, fact-check of the “€1.9 billion a year” claim (rated “Impreciso”).





Comentários
Enviar um comentário