The Light Arrives Late

How do we know the shapes of galaxies, or that the universe had a beginning? Almost all of it arrived as pictures, and every picture of the sky is a picture of the past.
How do we know anything about the universe? How do we know the shapes of galaxies, when so many of them seem to be spirals? How do we know there was a beginning? The honest answer is about pictures. Almost everything we know about the universe beyond the Solar System arrived as light, and it has been read the way a painter reads a scene: by shape, by brightness and by colour.
This is the short version of that answer, with the pictures in it, starting from a diagram physicists draw for what can reach what: the light cone.
Everything arrives late
Light is fast but not instant. The light from the Moon left it a little over a second ago; from the Sun, about eight minutes ago; from Andromeda, the nearest large galaxy, about two and a half million years ago. So the farther away we look, the further back in time we see. A telescope does not show the universe as it is. It shows each part of it as it was when the light set out.
That is what the light cone draws (Figure 1). Put yourself at the top, here and now. Everything you can see lies on the cone below you: the Moon a second down, the Sun eight minutes, the galaxies millions and billions of years. The same diagram appears in The Bus at Coutances, as one of the pictures physicists think with. Here it explains why astronomers can study how galaxies change without watching any of them change: they look at nearby galaxies and at distant ones, and the distant ones are younger pictures.
The first spiral was a drawing
In the spring of 1845 William Parsons, third Earl of Rosse, turned the largest telescope in the world, a mirror six feet across at Birr Castle in Ireland, on a faint smudge that Charles Messier had catalogued as number 51. Others had seen a blur. Rosse saw arms, curling out of a bright centre, and he drew them.[1] There was no camera that could record it. The drawing was the observation.
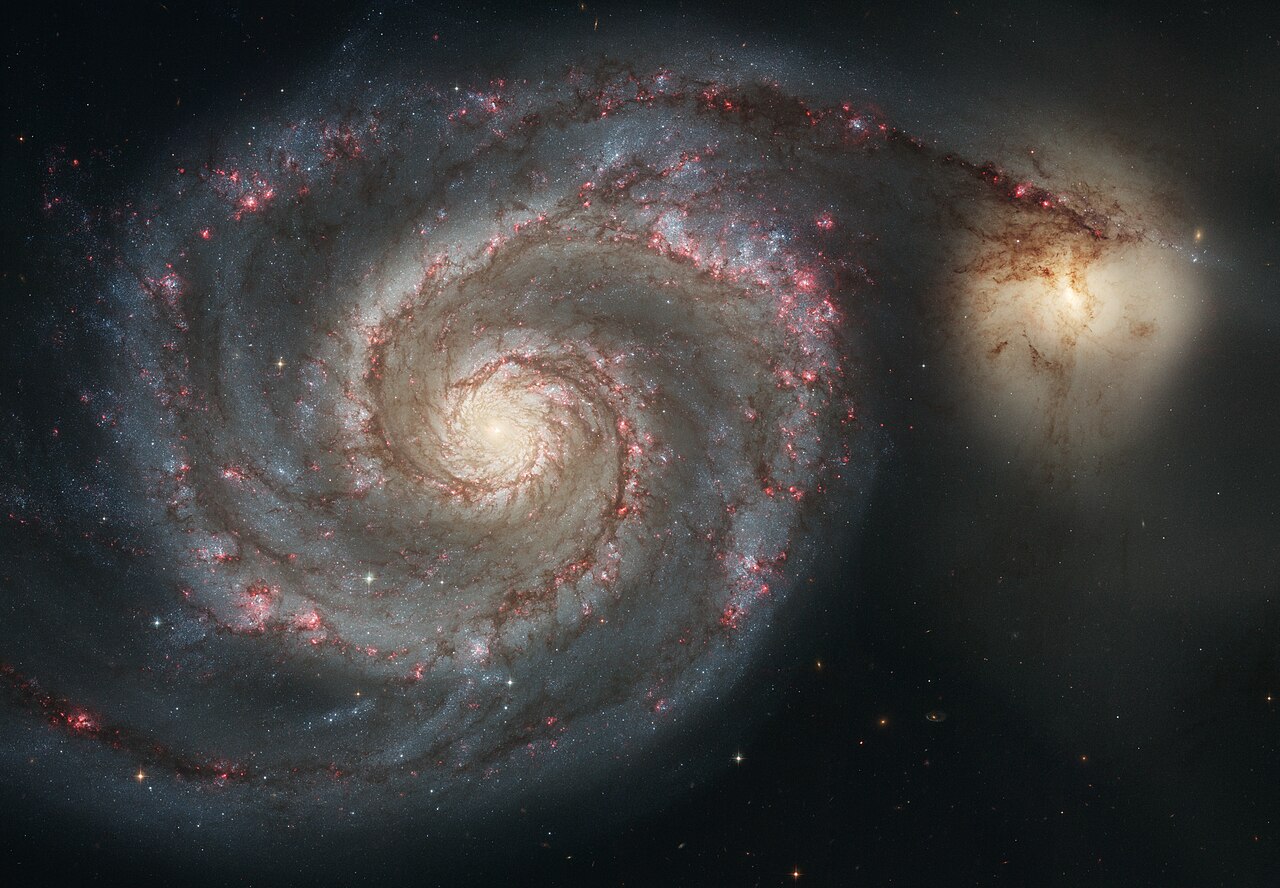
Put it beside the photograph the Hubble Space Telescope took of the same galaxy 160 years later (Figure 2) and the hand turns out to have been right.[2] The arms, the companion at the end of one of them, the sense of the whole thing turning: it is all in the pencil.

Painters may know the drawing without knowing it. The swirl in Van Gogh’s The Starry Night, painted in 1889, looks so much like Rosse’s spiral that the astronomer Charles Whitney and the art historian Albert Boime both suggested a link: the drawing was reproduced in popular astronomy books of the time, including those of Camille Flammarion. Nobody has found a document showing that Van Gogh saw it, so it remains a suggestion.[3]
Then the camera took over from the eye. From the 1880s telescopes recorded the sky on glass plates, and the plates could be measured. At Harvard, Henrietta Leavitt went through plates of the Magellanic Clouds and found that a kind of pulsing star, the Cepheids, pulses more slowly the brighter it really is. Compare how bright such a star looks with how bright its rhythm says it is, and you have its distance.[4] On the night of 5 October 1923 Edwin Hubble found one of these stars on a plate of Andromeda, crossed out the “N” he had written for a new star, and wrote “VAR!” beside it. The distance he worked out was less than half the modern figure, but it was enough: Andromeda was far outside our own galaxy, and the spiral nebulae were galaxies in their own right.[5] The size of the known universe changed because of a dot on a sheet of glass.
A shape from a million snapshots
A galaxy like ours turns once in a couple of hundred million years. Nobody will ever see one move, or walk around one to see its back. What the sky offers instead is numbers: millions of galaxies, frozen at every angle. Some face us, some are tilted, some are edge-on and look like a thin line with a bulge in the middle (Figure 3). From the collection, the shape can be worked out, the way you could learn the shape of a hat from a thousand portraits of people wearing it at different angles. Hubble sorted them in 1926 into ellipticals, spirals and barred spirals, by eye, and his scheme is still in use.[6]
Colour tells us how they move. Light from something coming towards us is shifted slightly towards blue, and from something moving away, slightly towards red. Point a spectrograph at the two sides of a tilted spiral and one side is bluer than the other: the galaxy is turning, and the shift gives the speed. When Vera Rubin and Kent Ford measured Andromeda this way in 1970, its outer parts were turning faster than the visible stars could explain, one of the first strong hints of the unseen mass now called dark matter.[7]
The arms are not solid things carried round like the spokes of a wheel; if they were, they would have wound up tight long ago. The standard explanation is that they are a pattern, a little like a traffic jam on a motorway: stars and gas pass through it, slow down, crowd together, and move on. The crowding makes gas collapse into new stars, and the brightest young stars are blue and short-lived, which is why the arms shine.[8]
Eyes still matter here. In 2007 the Galaxy Zoo project asked the public to classify galaxy images from a sky survey by eye, and about a hundred thousand volunteers sorted nearly a million of them, as reliably as the professionals.[9] A few weeks in, Hanny van Arkel, a Dutch schoolteacher, noticed a strange blue cloud beside one galaxy. It turned out to be gas lit up by the light of a quasar that has since gone dim, an echo of something no longer there.[10]
Are most galaxies spirals? Among the galaxies bright enough to classify in the big sky surveys, most nearby ones show spiral structure.[11] Counted one by one, though, most galaxies are small and faint. In our own neighbourhood, the Local Group, there are three spirals — the Milky Way, Andromeda and Triangulum — among dozens of dwarf galaxies with no arms at all.[12] The spirals are the ones we see first because they are big and bright.
The colours are chosen
This part may matter most to a painter. Telescope cameras do not record colour. They record brightness, one filter at a time, and each exposure is a black-and-white image. A colour picture is made by giving each of those images a colour and laying them on top of one another, and someone chooses the colours.
The best known choice is the “Hubble palette” used for the Pillars of Creation, the columns of gas in the Eagle Nebula. One filter catches the light of oxygen, one of hydrogen, one of sulphur, and they are shown as blue, green and red.[13] To the eye, hydrogen and sulphur would look almost the same deep red (Figure 4). The palette pulls them apart so that the chemistry can be seen: where the gas is hot, where it is being worn away, where it is dense. The James Webb telescope sees mostly infrared light, which no eye can see at all, so every colour picture from it is a translation.
None of this makes the pictures false. The choices are made to show something, and the filters are listed with each image, the way a painter’s choices can be read off the canvas. But a photograph of space is closer to a painting than it looks.
Was there a beginning?
Three separate lines of evidence point the same way, and each began as something seen.
The galaxies are moving apart. In 1927 Georges Lemaître, and in 1929 Hubble, found that the farther away a galaxy is, the more its light is shifted towards red: the farther, the faster it recedes.[14][15] The universe is expanding. Run the film backwards and everything was once much closer together, and hotter.
There is a leftover glow. In 1965 Arno Penzias and Robert Wilson, two engineers at Bell Labs, could not get rid of a faint microwave hiss in their antenna. It came from every direction, day and night.[16] It is the light released when the young universe, until then a glowing fog, cooled enough to become transparent, about 380,000 years after the start. Mapped across the whole sky (Figure 5), it is the oldest picture there can be made with light. Its blotches differ by about one part in a hundred thousand, and they are the seeds from which galaxies later grew.[17]

The recipe of the elements fits. The ordinary matter of the universe is about three-quarters hydrogen and one-quarter helium by mass, with traces of a few light elements. A universe that was once hot and dense enough to work as a nuclear furnace for a few minutes would make exactly that mixture.[18]
There is a fourth clue, and it needs no telescope: the night sky is dark. If the universe were infinite, unchanging and eternal, every line of sight would end on the surface of some star, and the whole sky would blaze. Part of the reason it does not is that the universe has a finite age: light from far enough away has not yet had time to reach us.[19] The darkness between the stars is the edge of the light cone, seen with the naked eye.
Put together, the measurements give an age of about 13.8 billion years since that hot, dense state.[20]
What the pictures cannot show
The honest answer to “was there a beginning?” has two parts. The evidence is very strong that 13.8 billion years ago the universe was hot, dense and expanding. Whether that was the beginning of time, or a phase of something older, is not known. Before the glow the universe was opaque, so no picture made with light can reach behind it, and the earliest moments are worked out from physics, not seen. The proposals about what came before are many, and most cannot yet be tested; Beyond the Reach of the Test looks at that kind of idea and at what happens when the test finally comes.
No single picture proves any of this. Rosse’s drawing, Leavitt’s plates, the colours of a spectrum and the map of the glow each need reading, and each could mislead on its own. What makes the story strong is that they agree: the ruler from the pulsing stars, the speeds from the colours, the glow and the recipe of the elements tell the same history. That may be the real power of images in science. They are not proof. They are the way of seeing that lets the pieces be held together, and painters have always known how to do that.
This piece was written collaboratively with Claude Opus 5.5 (Anthropic): human specification and editorial direction; machine research, analysis and drafting.
Figures 1, 3 and 4 and the cover are drawn by scripts/light_late.py; the light cone is schematic and not to scale, and the galaxy in Figure 3 is a computed spiral, not a photograph. Figures 2 and 5 are public-domain images hosted on Wikimedia Commons and credited in their captions. Hubble’s “VAR!” plate is described from the Carnegie Observatories’ account, and the Van Gogh link is reported as a suggestion because no document confirms it.
Authored by: Luis Matos Ferreira — Physicist, Developer, Writer
- The Bus at Coutances — how mathematicians and physicists think in pictures, and what happens to people who have none.
- The Diagram That Did the Sum — Feynman’s diagrams, the case in which a private picture became a whole field’s way of calculating.
- Beyond the Reach of the Test — physics proposals that cannot yet be tested, and the record of those that were.
- Earl of Rosse, “Observations on the Nebulae”, Philosophical Transactions of the Royal Society 140, 499–514 (1850); the 1845 sketch of M51 on Wikimedia Commons (public domain).
- NASA, ESA, S. Beckwith (STScI) and the Hubble Heritage Team, “The Whirlpool Galaxy (M51) and companion galaxy”, April 2005.
- “Was Van Gogh’s ‘Starry Night’ inspired by a scientific drawing?”, The World, 29 January 2015; A. Boime, “Van Gogh’s Starry Night: A History of Matter and a Matter of History”, Arts Magazine 59 (December 1984), as reported.
- H. S. Leavitt and E. C. Pickering, “Periods of 25 Variable Stars in the Small Magellanic Cloud”, Harvard College Observatory Circular 173 (1912).
- E. Hubble, “Cepheids in spiral nebulae”, The Observatory 48, 139–142 (1925); Carnegie Science, “The VAR! plate” (plate H335H, night of 5–6 October 1923).
- E. Hubble, “Extragalactic nebulae”, The Astrophysical Journal 64, 321–369 (1926).
- V. C. Rubin and W. K. Ford, “Rotation of the Andromeda Nebula from a Spectroscopic Survey of Emission Regions”, The Astrophysical Journal 159, 379 (1970).
- C. C. Lin and F. H. Shu, “On the Spiral Structure of Disk Galaxies”, The Astrophysical Journal 140, 646 (1964).
- C. Lintott et al., “Galaxy Zoo: Morphologies derived from visual inspection of galaxies from the Sloan Digital Sky Survey”, Monthly Notices of the Royal Astronomical Society 389, 1179 (2008).
- C. Lintott et al., “Galaxy Zoo: ‘Hanny’s Voorwerp’, a quasar light echo?”, MNRAS 399, 129 (2009); “Dutch Teacher Stumbles Upon A Space Ghost”, NPR, 9 August 2008.
- R. E. Hart et al., “Galaxy Zoo: comparing the demographics of spiral arm number and a new method for correcting redshift bias”, MNRAS 461, 3663 (2016).
- A. W. McConnachie, “The observed properties of dwarf galaxies in and around the Local Group”, The Astronomical Journal 144, 4 (2012).
- NASA, ESA and the Hubble Heritage Team, “New view of the Pillars of Creation — visible”, January 2015 (filters: [O III] 502 nm blue, Hα and [N II] 657 nm green, [S II] 673 nm red).
- G. Lemaître, “Un Univers homogène de masse constante et de rayon croissant”, Annales de la Société Scientifique de Bruxelles 47, 49–59 (1927).
- E. Hubble, “A Relation between Distance and Radial Velocity among Extra-Galactic Nebulae”, Proceedings of the National Academy of Sciences 15, 168–173 (1929).
- A. A. Penzias and R. W. Wilson, “A Measurement of Excess Antenna Temperature at 4080 Mc/s”, The Astrophysical Journal 142, 419 (1965).
- NASA / WMAP Science Team, “Nine Year Microwave Sky”, December 2012.
- B. D. Fields, P. Molaro and S. Sarkar, “Big-Bang Nucleosynthesis”, review for the Particle Data Group (2014).
- E. Harrison, Darkness at Night: A Riddle of the Universe, Harvard University Press (1987).
- Planck Collaboration, “Planck 2018 results. VI. Cosmological parameters”, Astronomy & Astrophysics 641, A6 (2020).


Comentários
Enviar um comentário